PROJECT: GRADE FIGURE-OUTERER (gfoX)
OBJECTIVE
To successfully obtain, input, calculate, and derive your current overall status in the course through the use of a spreadsheet calculator.
BACKGROUND
For this project, you will be installing the sc spreadsheet on your development system (Raspberry pi or other local UNIX/Linux machine you are using for class transactions), creating a spreadsheet and using it to tabulate and compute your current status in the class.
It is likely available for install via your package management system by
the name of sc.
SC INSTRUCTIONS
There are two sources of information you can reference for sc operation:
MANUAL PAGE
With the installation of sc the manual page is made available for viewing ('q' to quit, up/down pageup/pagedown to view):
yoursystem:~$ man scSC TUTORIAL
In the manual page there is given reference to an available sc tutorial, also installed with the sc package (tutorial itself tells you how to exit):
yoursystem:~$ sc /usr/share/doc/sc/tutorial.scRUNNING
To operate sc, run it and provide the desired spreadsheet calculator
filename you wish to work on.
While not a requirement, the convention is to add a .sc to the end of
your spreadsheet filename, for example: gfo0.sc
SAVING
One can use the P command to "Put" the file to the filesystem (ie saving).
NOTE: unlike in text editors, the sc status line is at the top of the screen.
LOOK UP YOUR STATUS
Ever since the first projects came due and were evaluated, your results were accessible to you on lab46 via the status command.
The synopsis for the status command is:
status DESIG [OPTION..]Where OPTION is any valid presence and combination of viable options (detail is one, help is another).
The most common usage will probably be (square brackets in this context denote optionality):
status DESIG [detail]Customize per the desired request. If you do not want the detailed view,
omit the detail option. If you desire it, include the detail option.
NOTE: status and the data it reads from are only accessible on lab46.
lab46:~$ status DESIGFurthermore, if you were curious about the breakdown of points, you could also append the 'detail' argument to get an expanded view of information:
lab46:~$ status DESIG detailNOTE: because 'detail' is an optional argument we use the square brackets to denote optionality. You do not type them, instead, you either type what is in them, or you do not, depending on desired functionality.
CALCULATING YOUR GRADE
Your grade is calculated from four distinct components, three of which you regularly encounter each week through the semester, and the final one at the end. Each is worth a certain amount of overall points, that when added up equals 104 points. With their individual point values, they are:
- projects (52 points)
- notes (13 points)
- participation (13 points)
- eoce (26 points)
Within each category, you tally up two different accumulation of points:
- all the points YOU got
- all the points POSSIBLE to get
For example, take this sample participation dataset:
1:wcp1:final tally of results (1/1)
2:wcp2:final tally of results (2/2)
1:wcp3:final tally of results (1/4)
5:wcp4:final tally of results (5/8)
4:moar:final tally of results (4/0)
This person got 1+2+1+5 points (and 4 bonus points), for a total of: 9 + 4 = 13 points.
The total amount of points available (at this point) was 1+2+4+8+0, or: 15 points
A note on 'bonus' points: in each category, there is the potential for the accumulation of bonus/extra/moar points. These are added into the mix, BUT for the purposes of grading, the final tally of YOUR points can NOT exceed the final tally of total points.
In this case, the person amassed 13 total points, out of a total of 15 points: for purposes of grading, for their participation score, it would be 13/15. Bonus points only apply to the particular category in which they were earned (they cannot be applied to a different category).
Continuing this example, the person got 13/15ths of the 13 available points for that section (participation is worth 13 total points). We would calculate that "out of 13" result as follows:
(13/15)*13 = 11 (so at this point, they'd have 11 out of 13
participation points)
Do the same for projects (52) and notes (13). For now, the total possible grade points you can receive is 78 total points (52+13+13). So that is what your spreadsheet should reflect.
Your letter grade is obtained by determining your score (out of 100) and selecting the letter grade pertaining to that value.
SPREADSHEET
For this project, your task is to make a spreadsheet that, in clearly readable and organized fashion, plots out your various results on the different deliverables for the class, ultimately displaying your current overall grade for the course.
I want to see each project (identified), along with the points you got, along with the total points possible for a "dashboard" quick glance, calculate your project "score" out of 100 (just to give you a feel for how you did on a particular project). Be sure to:
- have a category for bonus points you have earned
- have a projects score tally (all your points earned)
- have a projects total tally (all the points possible to earn)
Calculate your projects "score" out of 100 (just to give you a feel for how you did on the category overall).
Calculate your projects "points" (out of 52), and display it under an identifiable label.
Do the same for the participation and notes categories as well.
Add up your category points (52+13+13=78), and have these be near each other in your spreadsheet.
Calculate your actual current score for the class (based on a total of 78 points, that you could then determine against the letter grade ladder where you fall).
Do NOTE: the aim and spirit of this project is to use the SPREADSHEET as the calculator. I want to see embedded equations, NOT pre-calculated values in your spreadsheet data. I do NOT want to see you being the calculator, pre-calculating all the values, and just entering them. That is NOT effective use of the spreadsheet.
Note that you may have to make your terminal window larger, or just deal with the need to scroll through the spreadsheet when enough data is accumulated. If you'd like to continue using this spreadsheet for additional points accrued in the coming weeks, you may want to plan ahead and set up your "final results" tally with some space away from the growing list of results.
TIME-SENSITIVE DATA
As gfoX may be issued multiple times during the semester, each iteration is to capture the following snapshot of data in its reporting results:
- gfo0: start of semester through and including week 4 deliverables
- gfo1: start of semester through and including week 8 deliverables
- gfo2: start of semester through and including week 12 deliverables
You'll notice there is a two-week lag from the end of the sampling window (gfo0 -> week 4) and when that project is due (gfo0 will be due alongside pct6/wcp6).
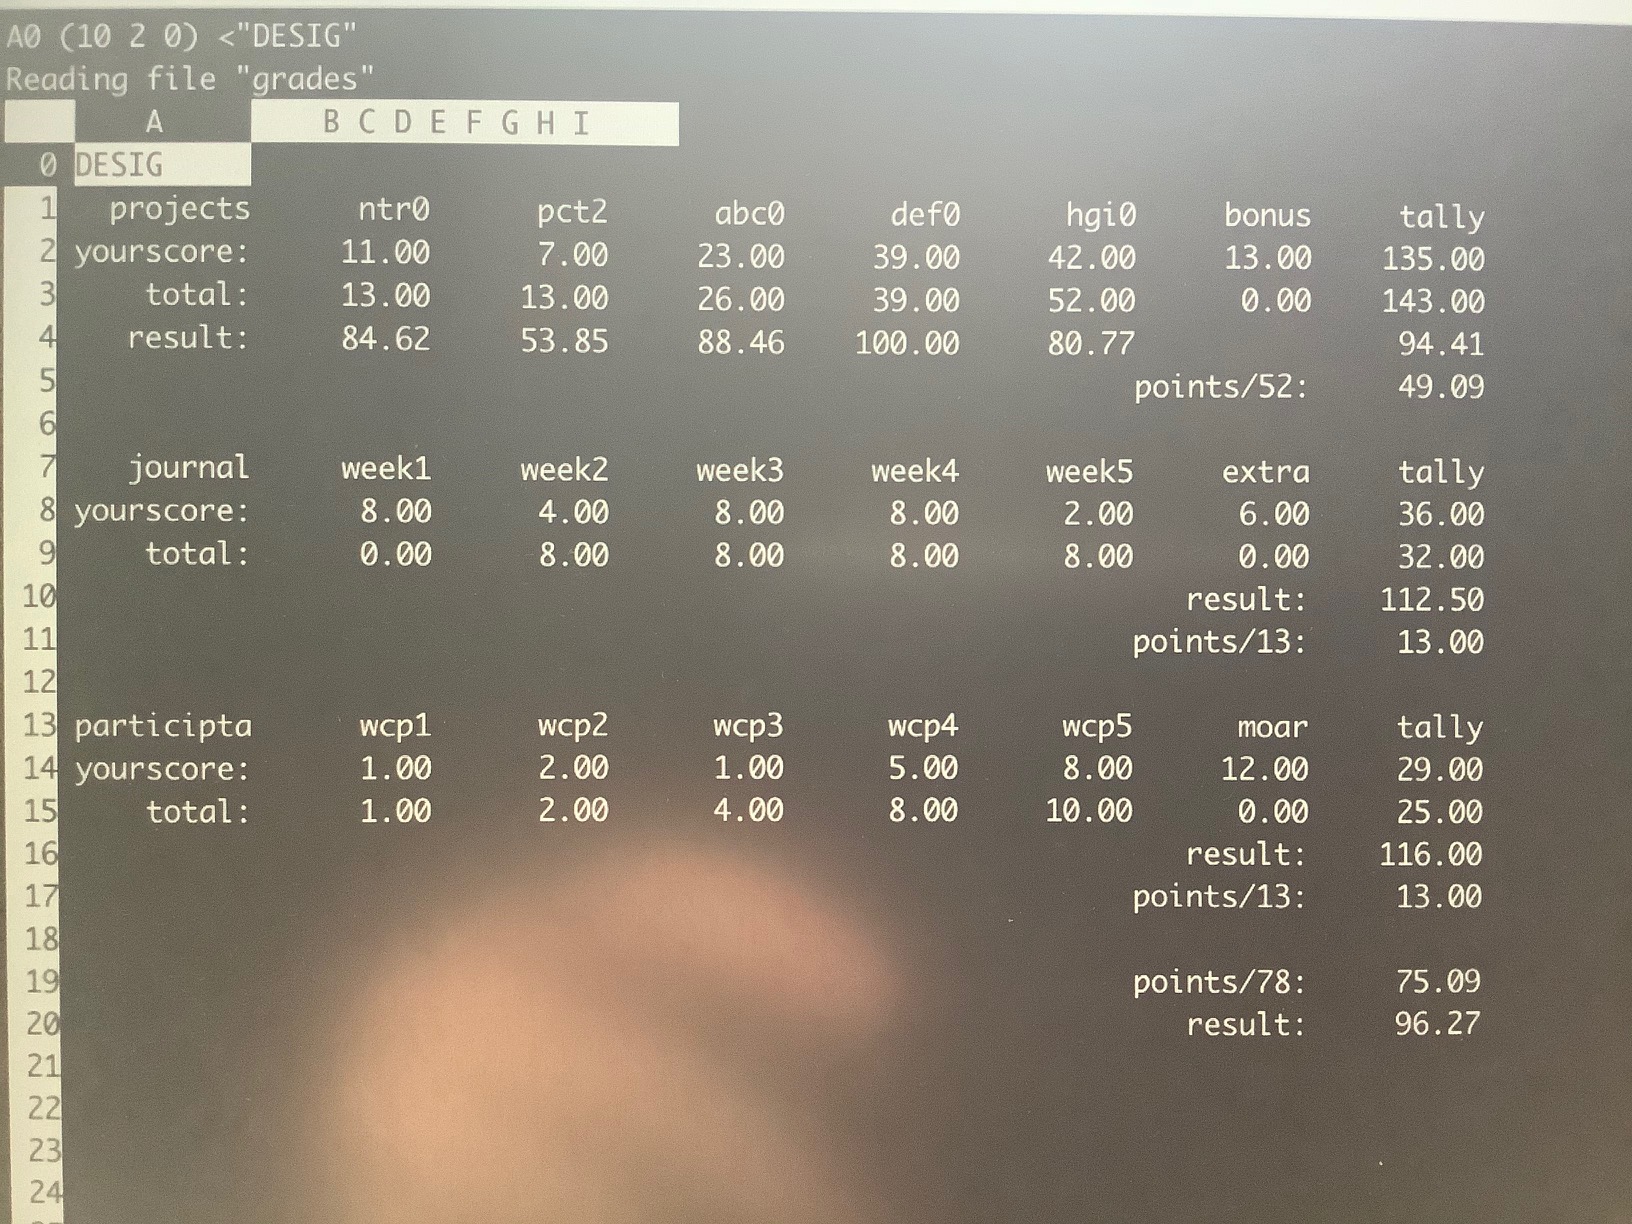
EXAMPLE
Here is a mock-up example spreadsheet that I did, organizing information in the fashion useful for being informative and pertaining to this project:
SUBMISSION
To successfully complete this project, the following criteria must be met:
- Solution must utilize the algorithm/approach presented above
- Output must conform to the specifications presented above
- Submit a copy of your solution to me using the submit tool.
To submit this to me using the submit tool, run the following command at your lab46 prompt:
lab46:~/src/SEMESTER/DESIG/gfoX$ submit DESIG gfoX gfoX.sc
Submitting DESIG project "gfoX":
    -> gfoX.sc(OK)

SUCCESSFULLY SUBMITTED
You should get some sort of confirmation indicating successful submission if all went according to plan. If not, check for typos and or locational mismatches.
RUBRIC
What I will be looking for:
52:gfoX:final tally of results (52/52)
*:gfoX:gfoX.sc data points entered as numbers, adequately labelled [13/13]
*:gfoX:gfoX.sc all calculations done as equations in spreadsheet [13/13]
*:gfoX:gfoX.sc calculations reference cells, NOT literal data [13/13]
*:gfoX:gfoX.sc calculations use available spreadsheet functions [13/13]
Additionally:
- Solutions not abiding by SPIRIT of project will be subject to a 25% overall deduction
- Solution output lacking ORGANIZATION ior are not easy to read (within 90 char width) are subject to a 25% overall deduction