Table of Contents
C for Engineers Fall 2019 Status
Data and visualizations generated from class activity.
This information is provided to give you a better perspective on how the class as a whole is trending.
Numeric Stats on Deliverables
============================================================================================================================================================================
C4ENG     cci0 pct1 pct2 pct3 sof0 dow0 pct4 pct5 epf0 mtf0 mtf1 pct6 pct7 bcf0 epf1 cnv0 pct9 cnv1 pctA pctB fwf0  got+bns/totl tlly prjct+prtcp+jrnal=results ( grade )
============================================================================================================================================================================
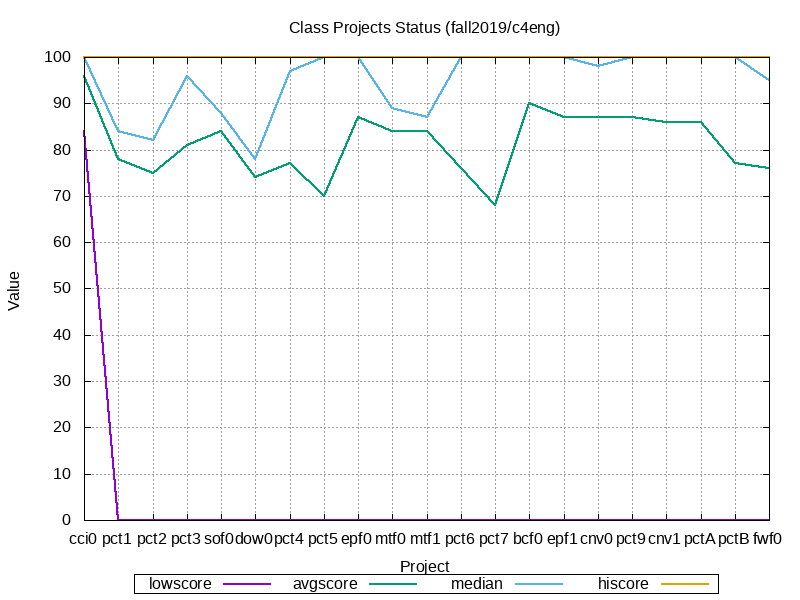
 lowscore:  84    0    0    0    0    0    0    0    0    0    0    0    0    0    0    0    0    0    0    0    0 .............   1% ......................... (  3.773)
 avgscore:  96   78   75   81   84   74   77   70   87   84   84   76   68   90   87   87   87   86   86   77   76 .............  87% ......................... (106.240)
   median: 100   84   82   96   88   78   97  100  100   89   87  100  100  100  100   98  100  100  100  100   95 .............  90% ......................... ( 91.553)
  hiscore: 100  100  100  100  100  100  100  100  100  100  100  100  100  100  100  100  100  100  100  100  100 ............. 111% ......................... (108.451)
     mode: 100   84  100  100  100   92  100  100  100   89  100  100  100  100  100  100  100  100  100  100  100
    range:  16  100  100  100  100  100  100  100  100  100  100  100  100  100  100  100  100  100  100  100  100
============================================================================================================================================================================
 # passed:  24   20   21   21   23   21   20   17   21   23   22   19   17   23   21   22   21   22   21   19   20 .............   22 ......................... 23 ( 95%)
  # of As:  20    8    8   12    7    4   13   16   21    5    8   16   13   16   21   15   20   16   18   17   12 .............    8 .........................  9 ( 37%)
  # of Bs:   4   11    7    7   13   10    4    1    0   14   14    1    2    5    0    5    1    2    3    1    4 .............   13 ......................... 12 ( 50%)
  # of Cs:   0    0    5    2    3    6    3    0    0    4    0    2    2    2    0    2    0    4    0    1    4 .............    1 .........................  1 (  4%)
  # of Ds:   0    1    1    0    0    1    0    0    0    0    0    0    0    0    0    0    0    0    0    0    0 .............    0 .........................  1 (  4%)
  # of Fs:   0    4    3    3    1    3    4    7    3    1    2    5    7    1    3    2    3    2    3    5    4 .............    2 .........................  1 (  4%)
 # submit:  29   27   25   23   24   22   20   18   21   23   23   20   17   23   21   23   21   22   21   19   19
  # early:  26    9    6    6   11    7    5    8   13   19    8    9    8   15   10   12    7    7   11    8   18
  # onday:   1   14   17   16   11   11   12    9    8    4   14   10    6    8   10    9   14   15   10   10    2
   # late:   1    2    2    1    1    4    3    1    1    1    1    1    3    1    1    2    1    1    1    1    1
# missing:   2    4    3    5    6    4    6    9    5    3    3    6    9    2    5    1    3    2    3    5    4
 % passed: 100%  83%  87%  87%  95%  87%  83%  70%  87%  95%  91%  79%  70%  95%  87%  91%  87%  91%  87%  79%  83%
  % of As:  83%  33%  33%  50%  29%  16%  54%  66%  87%  20%  33%  66%  54%  66%  87%  62%  83%  66%  75%  70%  50%
  % of Bs:  16%  45%  29%  29%  54%  41%  16%   4%   0%  58%  58%   4%   8%  20%   0%  20%   4%   8%  12%   4%  16%
  % of Cs:   0%   0%  20%   8%  12%  25%  12%   0%   0%  16%   0%   8%   8%   8%   0%   8%   0%  16%   0%   4%  16%
  % of Ds:   0%   4%   4%   0%   0%   4%   0%   0%   0%   0%   0%   0%   0%   0%   0%   0%   0%   0%   0%   0%   0%
  % of Fs:   0%  16%  12%  12%   4%  12%  16%  29%  12%   4%   8%  20%  29%   4%  12%   8%  12%   8%  12%  20%  16%
 % submit: 120% 112% 104%  95% 100%  91%  83%  75%  87%  95%  95%  83%  70%  95%  87%  95%  87%  91%  87%  79%  79%
  % early: 108%  37%  25%  25%  45%  29%  20%  33%  54%  79%  33%  37%  33%  62%  41%  50%  29%  29%  45%  33%  75%
  % onday:   4%  58%  70%  66%  45%  45%  50%  37%  33%  16%  58%  41%  25%  33%  41%  37%  58%  62%  41%  41%   8%
   % late:   4%   8%   8%   4%   4%  16%  12%   4%   4%   4%   4%   4%  12%   4%   4%   8%   4%   4%   4%   4%   4%
% missing:   8%  16%  12%  20%  25%  16%  25%  37%  20%  12%  12%  25%  37%   8%  20%   4%  12%   8%  12%  20%  16%
============================================================================================================================================================================
Correlation: Time Spent Online vs. Overall Class Ranking
| rank | user | inclass | outclass | total | program |
|---|---|---|---|---|---|
| 1 | 4631 | 4395 | 9026 | OTHR | |
| 2 | 5466 | 7260 | 12726 | CSCI | |
| 3 | 6119 | 2498 | 8617 | OTHR | |
| 4 | 7156 | 5981 | 13137 | INFT | |
| 5 | 5396 | 3557 | 8953 | OTHR | |
| 6 | 7141 | -7141 | 0 | OTHR | |
| 7 | 3356 | 8388 | 11744 | OTHR | |
| 8 | 3916 | -3916 | 0 | ||
| 9 | 4096 | 10031 | 14127 | ||
| 10 | 3878 | 3578 | 7456 | MECH | |
| 11 | 10088 | 13751 | 23839 | NONE | |
| 12 | 3684 | 7947 | 11631 | OTHR | |
| 13 | 2776 | 2543 | 5319 | OTHR | |
| 14 | 3652 | 3697 | 7349 | OTHR | |
| 15 | 6190 | 11224 | 17414 | OTHR | |
| 16 | 6427 | 11625 | 18052 | OTHR | |
| 17 | 7764 | 33662 | 41426 | OTHR | |
| 18 | 5954 | 118326 | 124280 | OTHR | |
| 19 | 4470 | 7120 | 11590 | OTHR | |
| 20 | 3404 | 3022 | 6426 | OTHR | |
| 21 | 4420 | 2826 | 7246 | OTHR | |
| 22 | 3915 | 2785 | 6700 | OTHR | |
| 23 | 3917 | 1537 | 5454 | CHEM | |
| 24 | 881 | 1380 | 2261 | OTHR | |
| rank | user | inclass | outclass | total | program |
Correlation: Time Spent Online vs. Project Ranking
| rank | user | inclass | outclass | total | program |
|---|---|---|---|---|---|
| 1 | 4631 | 4395 | 9026 | OTHR | |
| 2 | 7156 | 5981 | 13137 | INFT | |
| 3 | 5466 | 7260 | 12726 | CSCI | |
| 4 | 6119 | 2498 | 8617 | OTHR | |
| 5 | 5396 | 3557 | 8953 | OTHR | |
| 6 | 7141 | -7141 | 0 | OTHR | |
| 7 | 3356 | 8388 | 11744 | OTHR | |
| 8 | 6190 | 11224 | 17414 | OTHR | |
| 9 | 3684 | 7947 | 11631 | OTHR | |
| 10 | 3916 | -3916 | 0 | ||
| 11 | 4096 | 10031 | 14127 | ||
| 12 | 3652 | 3697 | 7349 | OTHR | |
| 13 | 3404 | 3022 | 6426 | OTHR | |
| 14 | 3878 | 3578 | 7456 | MECH | |
| 15 | 10088 | 13751 | 23839 | NONE | |
| 16 | 2776 | 2543 | 5319 | OTHR | |
| 17 | 7764 | 33662 | 41426 | OTHR | |
| 18 | 4420 | 2826 | 7246 | OTHR | |
| 19 | 6427 | 11625 | 18052 | OTHR | |
| 20 | 5954 | 118326 | 124280 | OTHR | |
| 21 | 4470 | 7120 | 11590 | OTHR | |
| 22 | 3915 | 2785 | 6700 | OTHR | |
| 23 | 3917 | 1537 | 5454 | CHEM | |
| 24 | 881 | 1380 | 2261 | OTHR | |
| rank | user | inclass | outclass | total | program |
Class Project Progress
Of the various all-class metrics we can analyze:
- low score
- average score
- median score
- high score
- submission rate
- late/missing rate
We can visualize the results to gain a big picture view. The more the data stays within a certain range, the less interesting the graphs will appear. In such cases, boring graphs indicate the class as a whole is staying relatively the same with respect to that metric (dips would tend to indicate problems, rises would tend to indicate improvements).

